Prateek Dua
2018-10-01 11:34:57 UTC
Hi,
I'm running Perfmon plugin via below command line & at the same time
running /startAgent.sh i.e. ./startAgent.sh --udp-port 0 --tcp-port 3450
.
$settings_path/bin/JMeterPluginsCMD.sh --generate-png
/var/lib/jenkins/workspace/$a6/${run}.png --input-jtl
/var/lib/jenkins/workspace/$a6/${run}.jtl --plugin-type PerfMon --width 800
--height 600
Also I've have configured below properties in jmeter.properties file .
jmeterPlugin.perfmon.interval=1000
jmeterPlugin.perfmon.useUDP= true
jmeterPlugin.perfmon.label.useHostname=true
jmeterPlugin.perfmon.label.useHostname.pattern=([\w\-]+)\..*
jmeterPlugin.perfmon.label.useHostname.pattern=([\w\-]+\.us-(east|west)-[0-9]).*
forcePerfmonFile=true
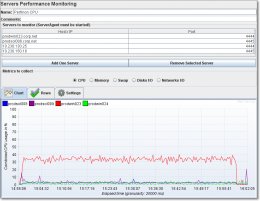
But Graph which I was expecting for Perfmon Metrics
<Loading Image... >is
>is
not getting generated. Instead this graph <https://imgur.com/a/KuqAFdL> is
getting generated.
--
::DISCLAIMER::
----------------------------------------------------------------------------------------------------------------------------------------------------
This message is intended only for the use of the addressee and may
contain information that is privileged, confidential and exempt from
disclosure under applicable law. If the reader of this message is not the
intended recipient, or the employee or agent responsible for delivering the
message to the intended recipient, you are hereby notified that any
dissemination, distribution or copying of this communication is strictly
prohibited. If you have received this e-mail in error, please notify us
immediately by return e-mail and delete this e-mail and all attachments
from your system.
I'm running Perfmon plugin via below command line & at the same time
running /startAgent.sh i.e. ./startAgent.sh --udp-port 0 --tcp-port 3450
.
$settings_path/bin/JMeterPluginsCMD.sh --generate-png
/var/lib/jenkins/workspace/$a6/${run}.png --input-jtl
/var/lib/jenkins/workspace/$a6/${run}.jtl --plugin-type PerfMon --width 800
--height 600
Also I've have configured below properties in jmeter.properties file .
jmeterPlugin.perfmon.interval=1000
jmeterPlugin.perfmon.useUDP= true
jmeterPlugin.perfmon.label.useHostname=true
jmeterPlugin.perfmon.label.useHostname.pattern=([\w\-]+)\..*
jmeterPlugin.perfmon.label.useHostname.pattern=([\w\-]+\.us-(east|west)-[0-9]).*
forcePerfmonFile=true
But Graph which I was expecting for Perfmon Metrics
<Loading Image...
not getting generated. Instead this graph <https://imgur.com/a/KuqAFdL> is
getting generated.
--
::DISCLAIMER::
----------------------------------------------------------------------------------------------------------------------------------------------------
This message is intended only for the use of the addressee and may
contain information that is privileged, confidential and exempt from
disclosure under applicable law. If the reader of this message is not the
intended recipient, or the employee or agent responsible for delivering the
message to the intended recipient, you are hereby notified that any
dissemination, distribution or copying of this communication is strictly
prohibited. If you have received this e-mail in error, please notify us
immediately by return e-mail and delete this e-mail and all attachments
from your system.